Making Quantum Experiments Observable
 Vlad Știrbu
A quantum experiment produces a result. Understanding that result requires knowing how it was obtained.
Which circuit did we run? How did the compiler transform it? Which backend did we target, and which settings did we use? If two runs produce different outcomes, what changed between them?
These questions become difficult to answer when the relevant information is scattered across notebooks, scripts and console output. Saving the measurement counts preserves the outcome, but much of the context needed to interpret the result can be lost.
With the q8s.runtime library, we are bringing that context into a single experiment record, starting with automatic tracking of quantum circuits and their compilation.
From running experiments to tracking experiments
Experiment tracking is an established practice in classical machine learning, with a large pool of practitioners and a rich ecosystem of tools. These tools allow developers to record configurations, measurements and generated files so that they can compare runs and trace results back to the conditions that produced them.
Quantum software needs the same discipline. A circuit may pass through several transformations before execution, and compiler settings can affect its depth, gate count and suitability for a target device. Recording these transformations helps explain differences that the final result alone cannot reveal.
Beyond individual development work, tracking also supports collaboration and reproducibility. A collaborator or a third party revisiting an experiment should be able to inspect its recorded context without reconstructing every step from the original notebook or script.
Meet q8s.runtime
The q8s.runtime library provides a common representation of quantum programs and their provenance, with integrations for Qiskit and Qrisp . Its main role is to connect quantum-specific information with MLflow’s experiment-tracking capabilities.
The design brings together two complementary models. The QProv attribute schema describes the context of a quantum experiment, organised around four categories: the quantum circuit, quantum computer, compilation and execution. MLflow provides a practical structure for storing and exploring experiment records, using experiments and runs that capture parameters, metrics and artifacts.
The diagram provides a simplified illustration of how a representative subset of QProv attributes maps to the MLflow model. Configuration values, such as a compiler’s random seed, can be stored as parameters. Numerical observations, such as circuit size and compilation time, become metrics. Richer records, such as circuit representations and gate mappings, can be preserved as artifacts. Runs collect these records, while experiments group related runs.
This mapping provides a foundation for broader provenance coverage. MLflow provides the tracking infrastructure; q8s.runtime supplies the quantum-specific instrumentation and a shared provenance representation, reducing the manual work needed to record circuits and compilation. The current implementation focuses on circuit and compilation information; the attributes available depend on the integration and workflow.
Start tracking with a small code change
For an existing Qiskit workflow, the entry point is:
from q8s.runtime.mlflow.qiskit import autolog

autolog()
Enabling autologging adds tracking to the supported operations in the workflow. Following standard MLflow conventions, an experiment groups related runs, while each run collects the information recorded during an individual workflow.
import mlflow

mlflow.set_experiment("blog")

with mlflow.start_run():
    ...
The example below creates a 10-qubit quantum Fourier transform circuit using the MQT Bench toolkit, compiles it for an IQM fake backend and executes it with 1000 shots. The fake backend allows the workflow to be explored without access to a physical QPU. Here, we focus on the circuit and compilation information collected during this workflow.
import mlflow
from mqt.bench import BenchmarkLevel, get_benchmark
from q8s.runtime.mlflow.qiskit import autolog

autolog()

from iqm.qiskit_iqm.fake_backends.fake_aphrodite import IQMFakeAphrodite
from qiskit.transpiler import generate_preset_pass_manager

mlflow.set_experiment("blog")


with mlflow.start_run():
    qc = get_benchmark(
        benchmark="qft",
        level=BenchmarkLevel.ALG,
        circuit_size=10,
    )

    backend = IQMFakeAphrodite()

    manager = generate_preset_pass_manager(
        optimization_level=3, backend=backend, seed_transpiler=42
    )

    tqc = manager.run(qc)

    job = backend.run(tqc, shots=1000, memory=True)

    result = job.result()

    result.get_counts()
Look inside the quantum compiler
A compiled circuit shows where the compiler ended up. However, understanding how it got there requires visibility into the intermediate steps.
The q8s.runtime library records information about individual compiler passes, including their names, durations and the circuit depth and size after each pass. For Qiskit, it also records the compilation stages. The library uses these observations to generate a transpilation timeline and automatically saves it as an MLflow artifact.
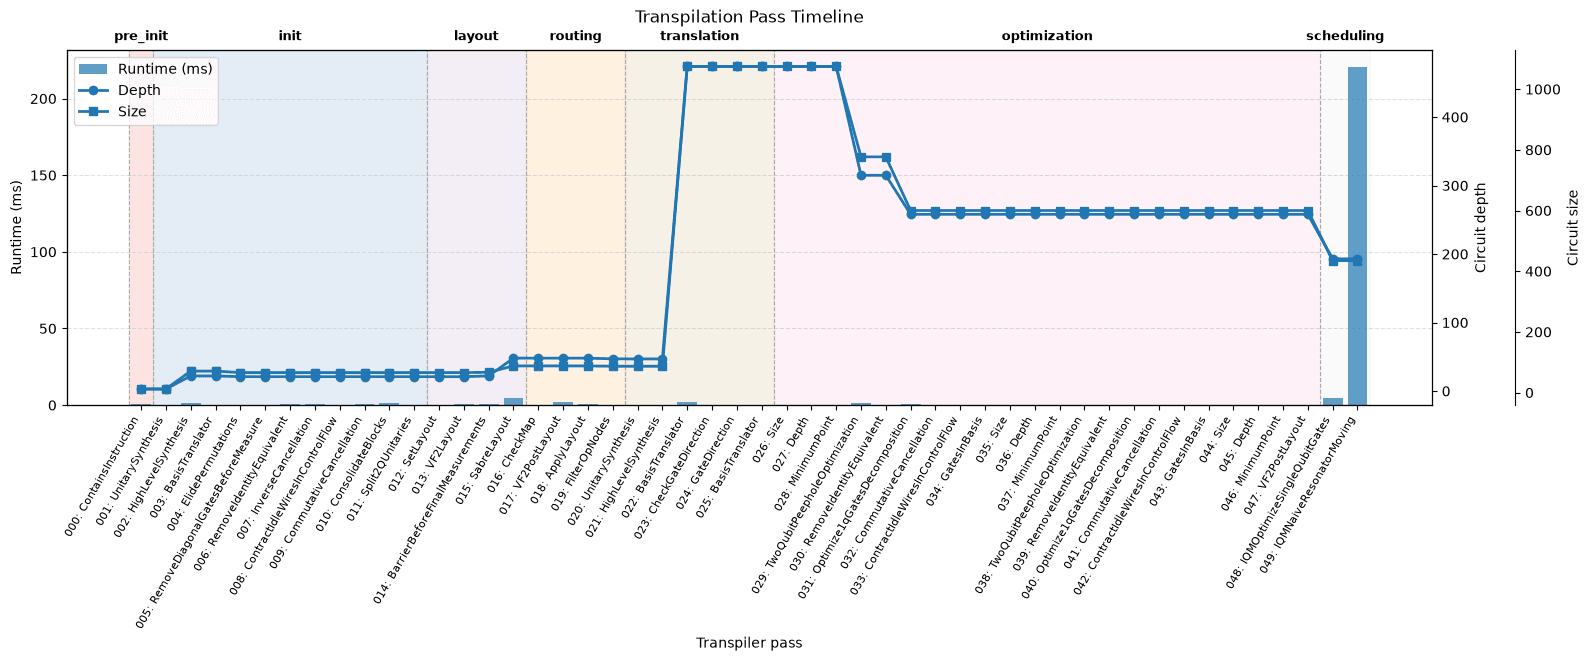
The timeline representation of the collected experiment record makes changes during compilation easier to inspect.
Where did the circuit grow? Which passes reduced its depth? Which steps took most of the compilation time?
This is useful when an optimisation setting produces an unexpected result. A final gate count may reveal a difference, while the timeline helps locate the transformations associated with it. Comparing timelines across runs provides a more detailed basis for investigating compiler behaviour.
Further, it makes compilation easier to explain, enabling developers and researchers to connect the final circuit to the sequence of transformations that produced it.
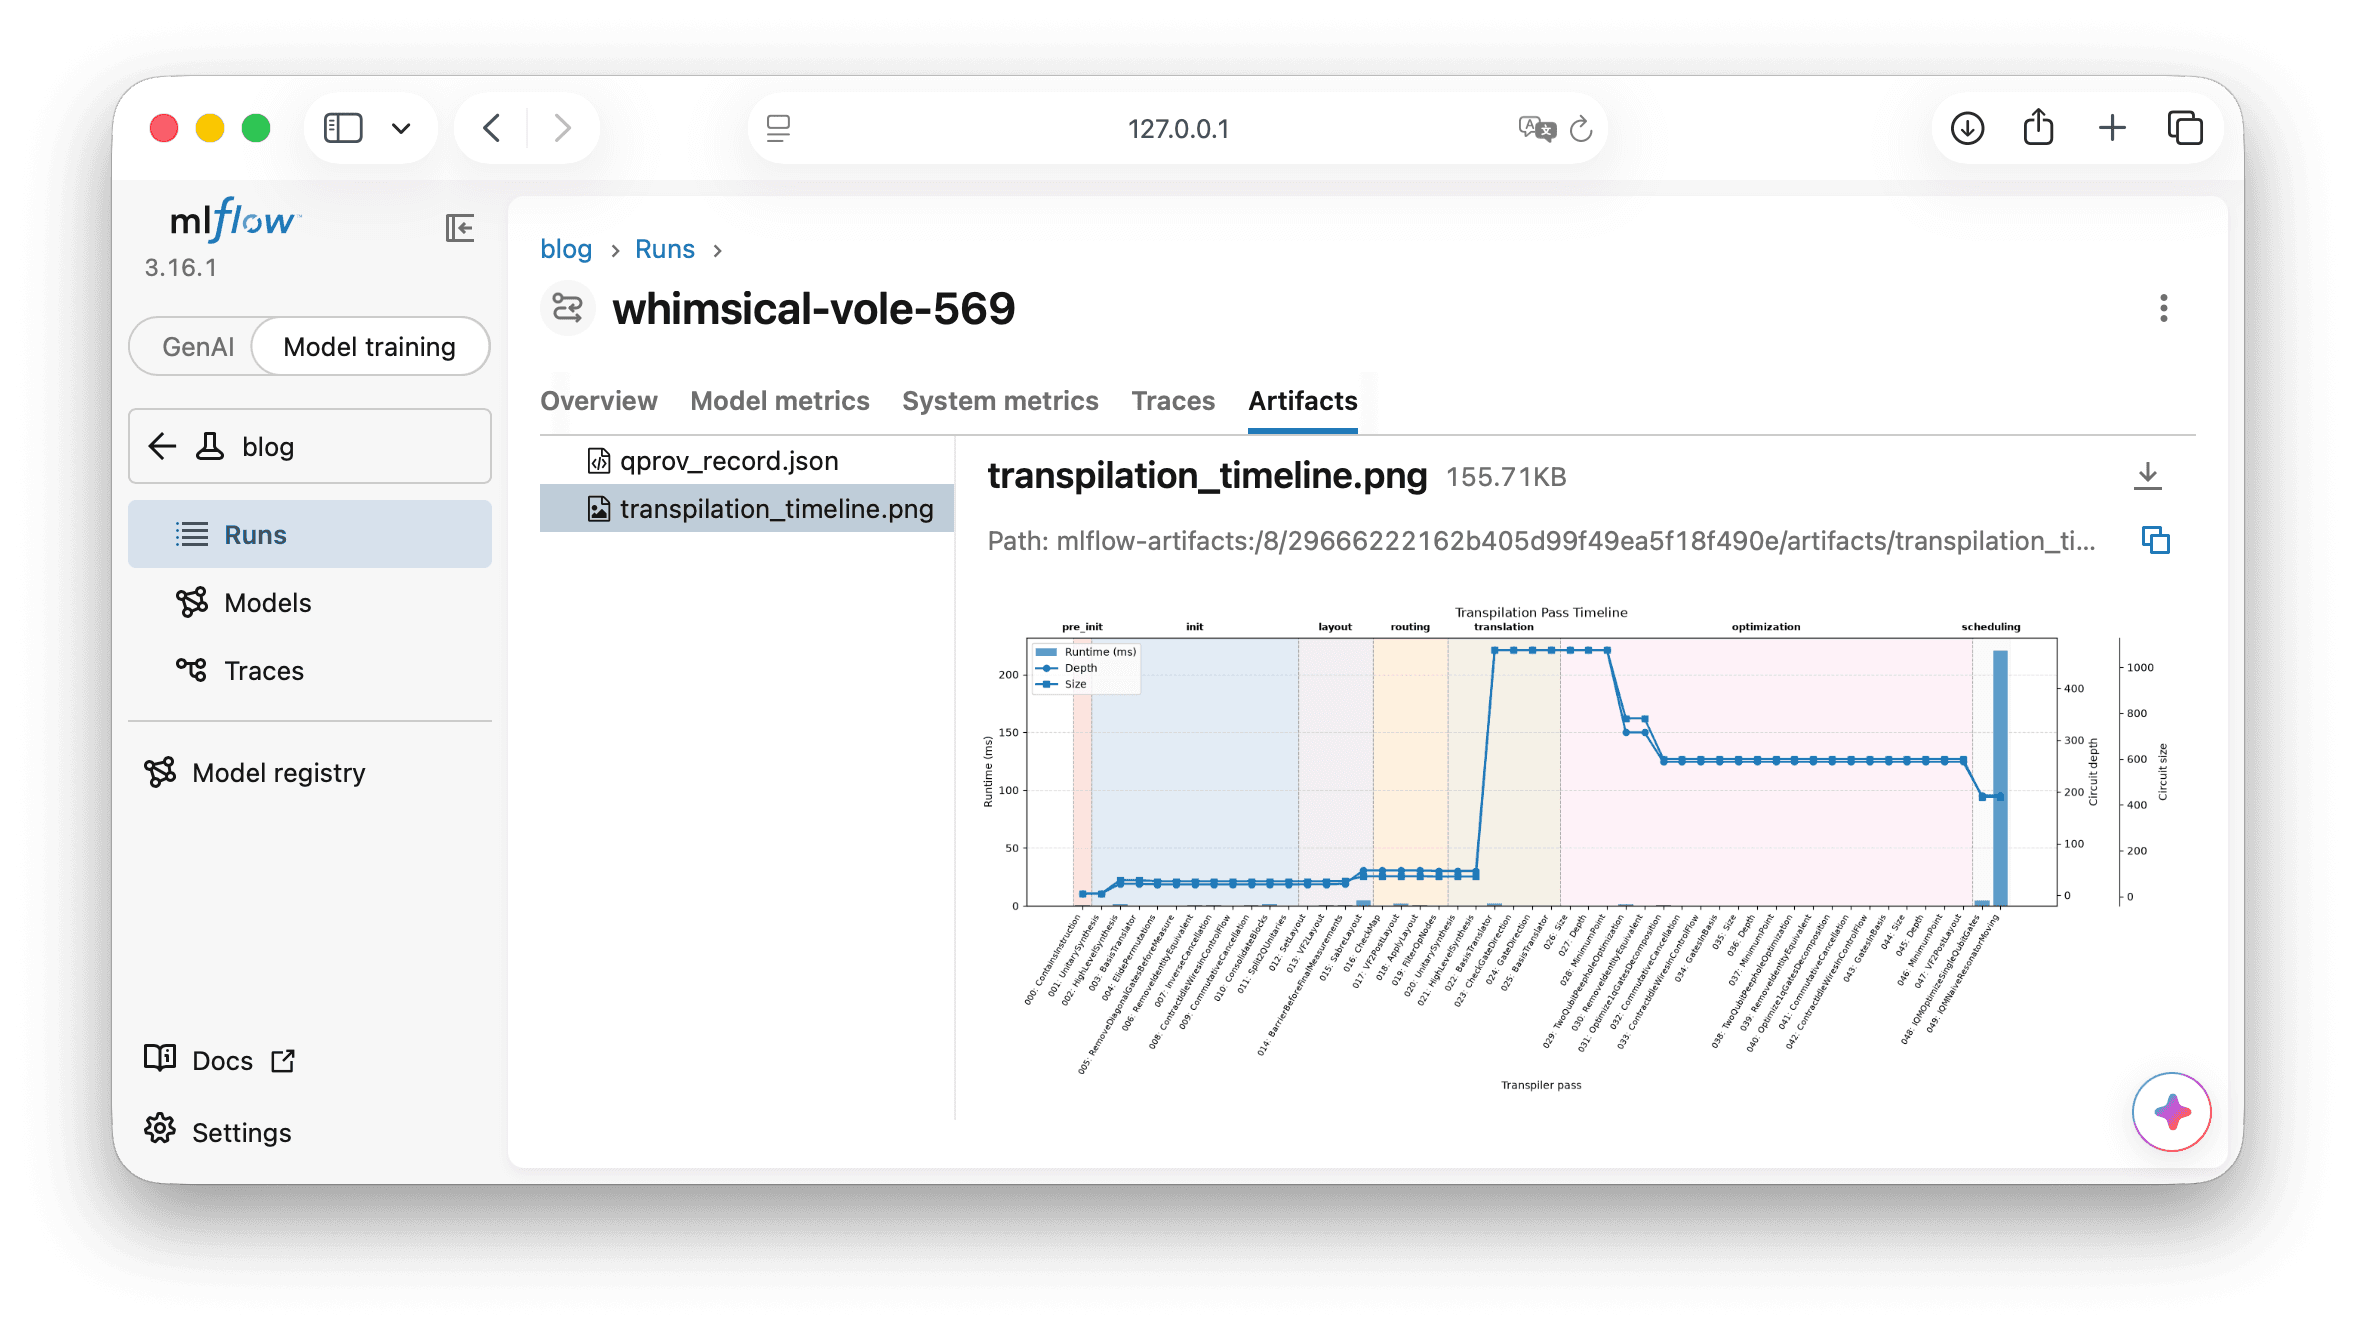
Open the recorded run in the MLflow web interface and select the Artifacts tab to find the transpilation timeline and the underlying experiment data in JSON format. The timeline supports visual inspection, while the JSON record allows further analysis of the collected observations.
A foundation for broader quantum experiment tracking
Compiler observability is one part of a larger goal: connecting a quantum result to the workflow that produced it.
A shared provenance representation provides a basis for collecting information consistently across quantum software stacks. The Qiskit and Qrisp integrations already use this common model for supported circuit and compilation attributes.
For developers, this can support debugging and optimisation. For researchers, it helps preserve the context needed to compare experiments. For infrastructure providers and hardware manufacturers, broader tracking could help connect workload characteristics with the behaviour of their systems.
There is more context to capture, particularly around execution and backend characteristics. Extending that coverage will make the experiment record more useful across the full quantum workflow.
Try it and help shape it
Find q8s.runtime on PyPI , and explore the source code, code samples and contribution options on GitHub .
pip install "q8s.runtime[qiskit]"Start with a circuit you already use, enable autologging and inspect the recorded compilation information. Then change one setting and compare the runs.
We welcome feedback, examples and contributions.
Which quantum SDKs and compilers do you use? Which information do you need to explain your experiments? Which compiler behaviours are difficult to inspect?
Your workflows can help guide the next integrations and provenance attributes we add.